Proof that my systems work (not just “cool demos”)
This page highlights measurable outcomes across my robotics work: simulation fidelity, stable control, task success, and repeatable evaluation — backed by artifacts (metrics, reports, and videos).
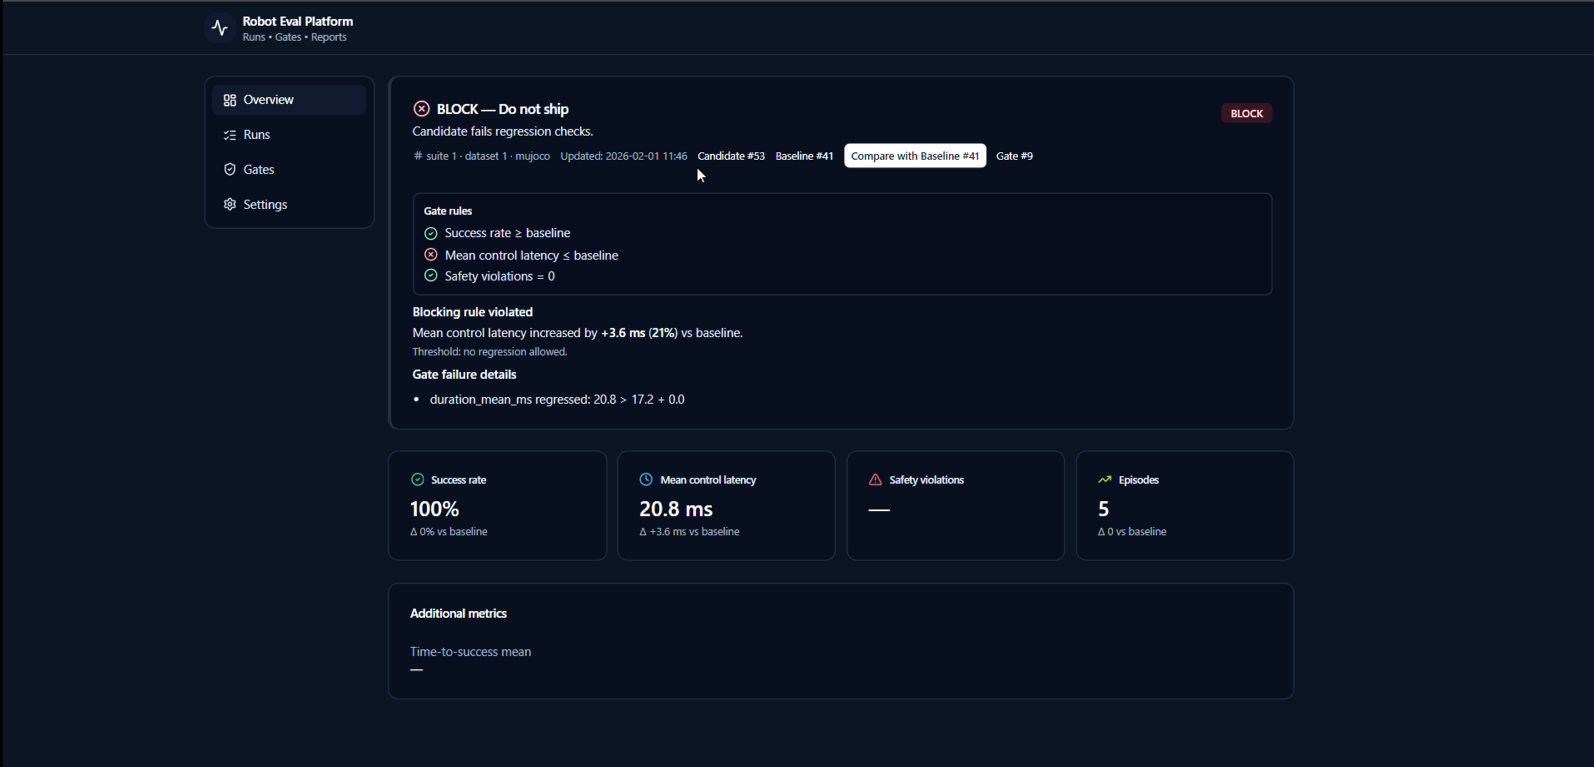
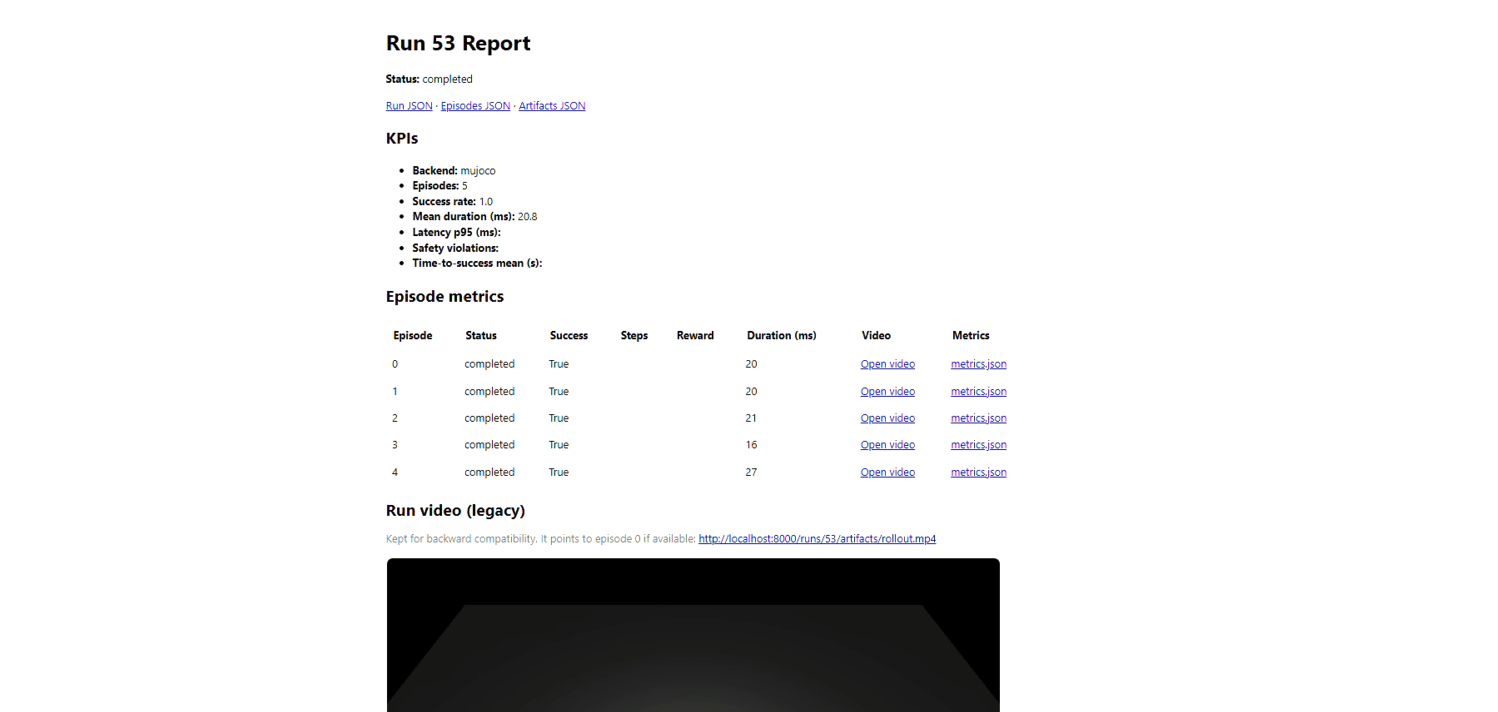
100%
Task Success Rate (Demo run)
Measured over 5 episodes in the Robot Eval Platform demo.
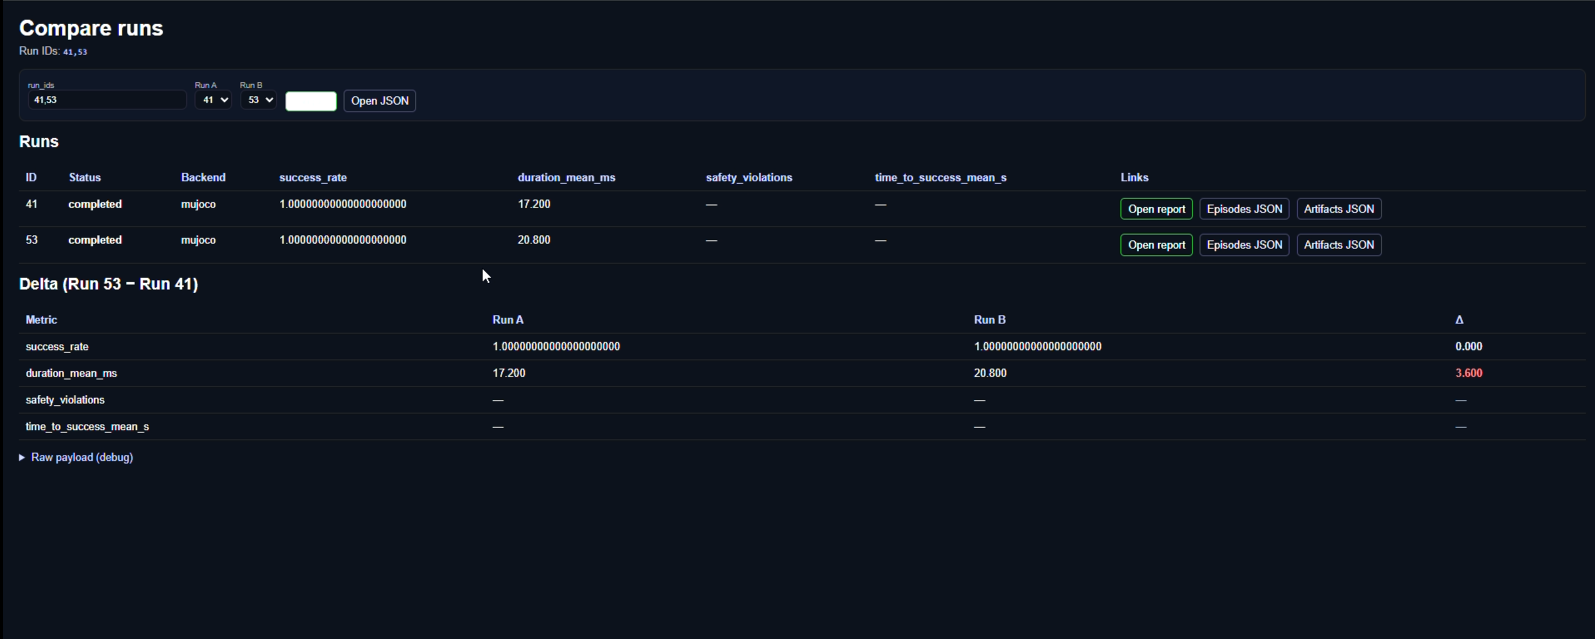
20.8 ms
Mean Control Latency (Candidate)
Regression detected: +3.6 ms (+21%) vs baseline 17.2 ms.
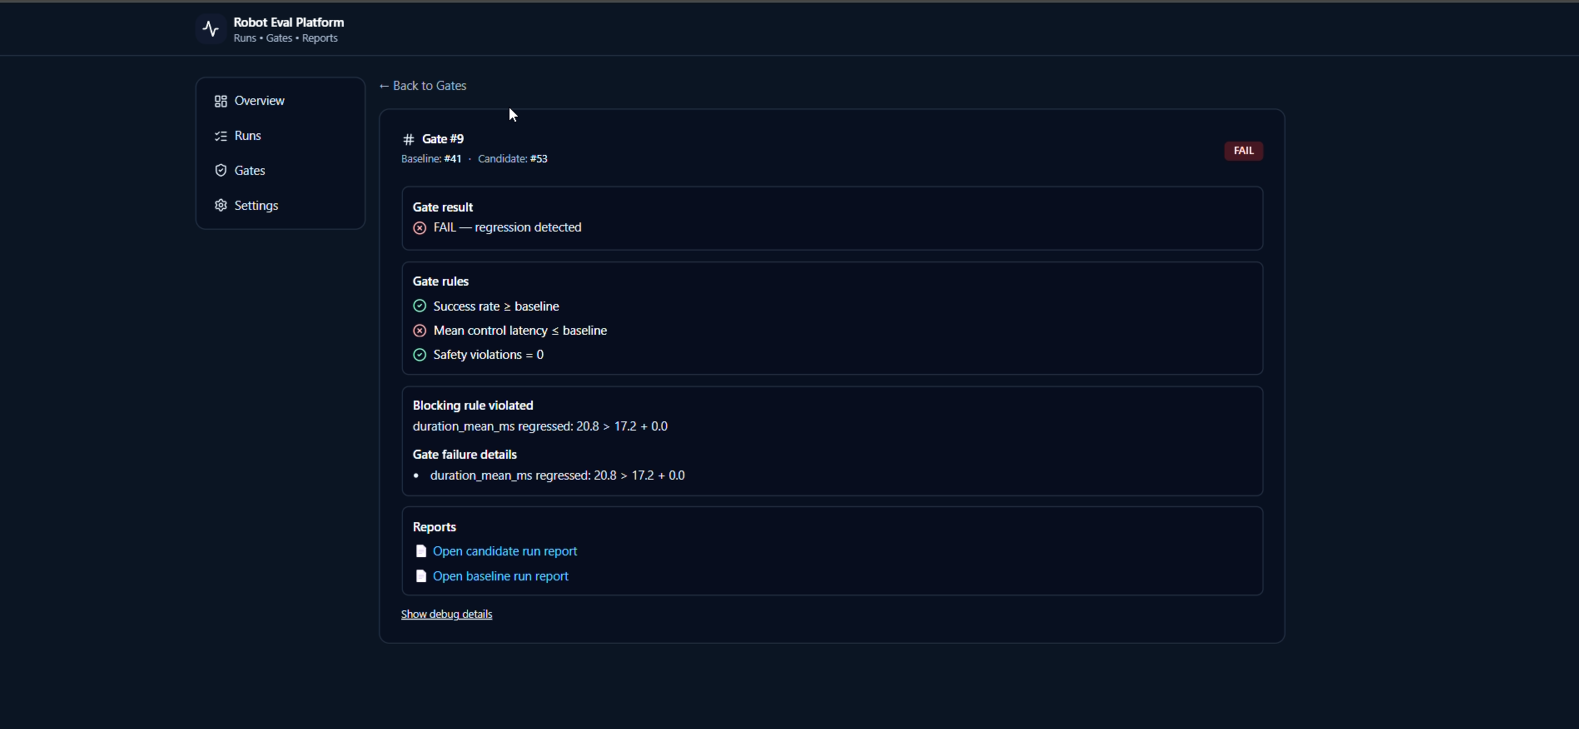
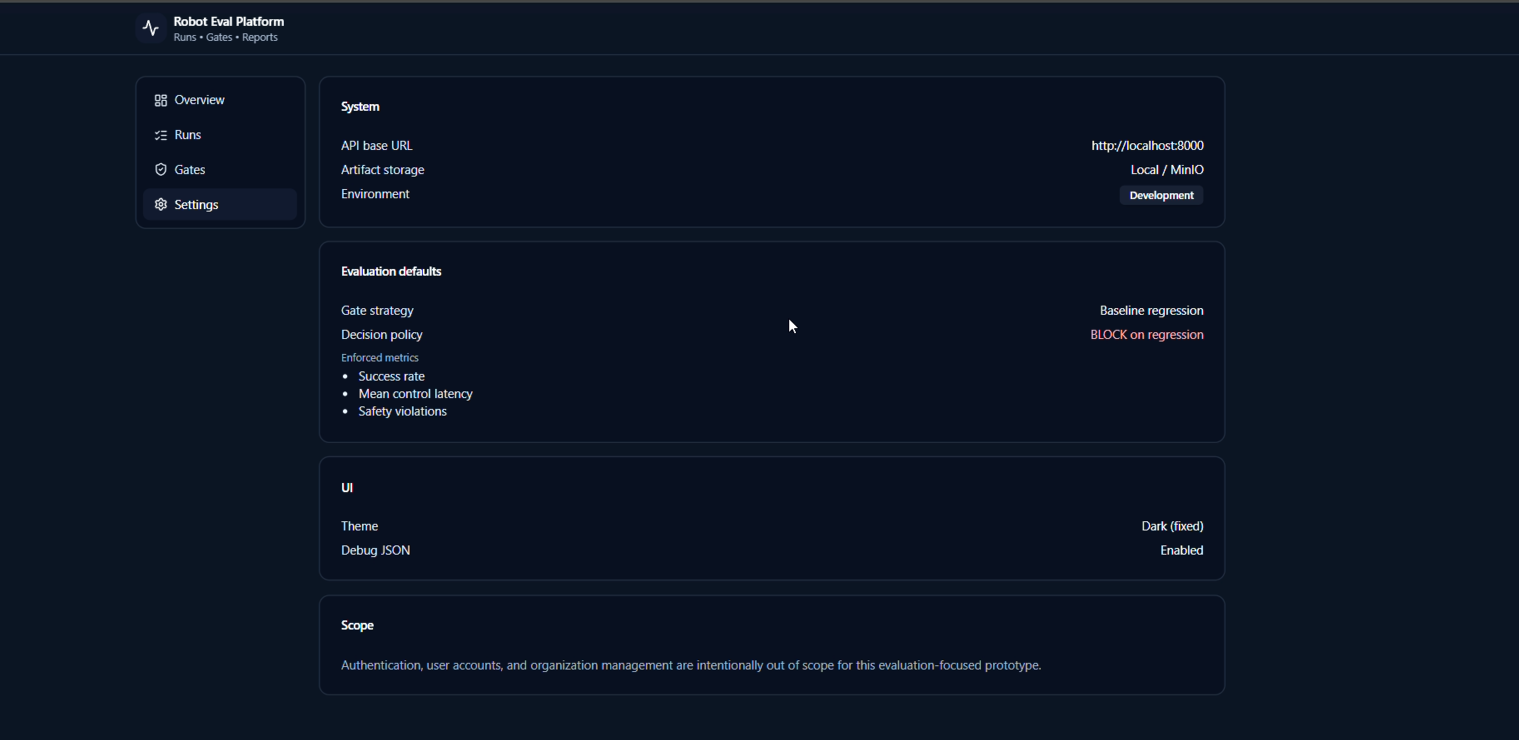
BLOCK
Release Gate Decision (Do not ship)
Candidate automatically blocked due to violating the latency regression rule.
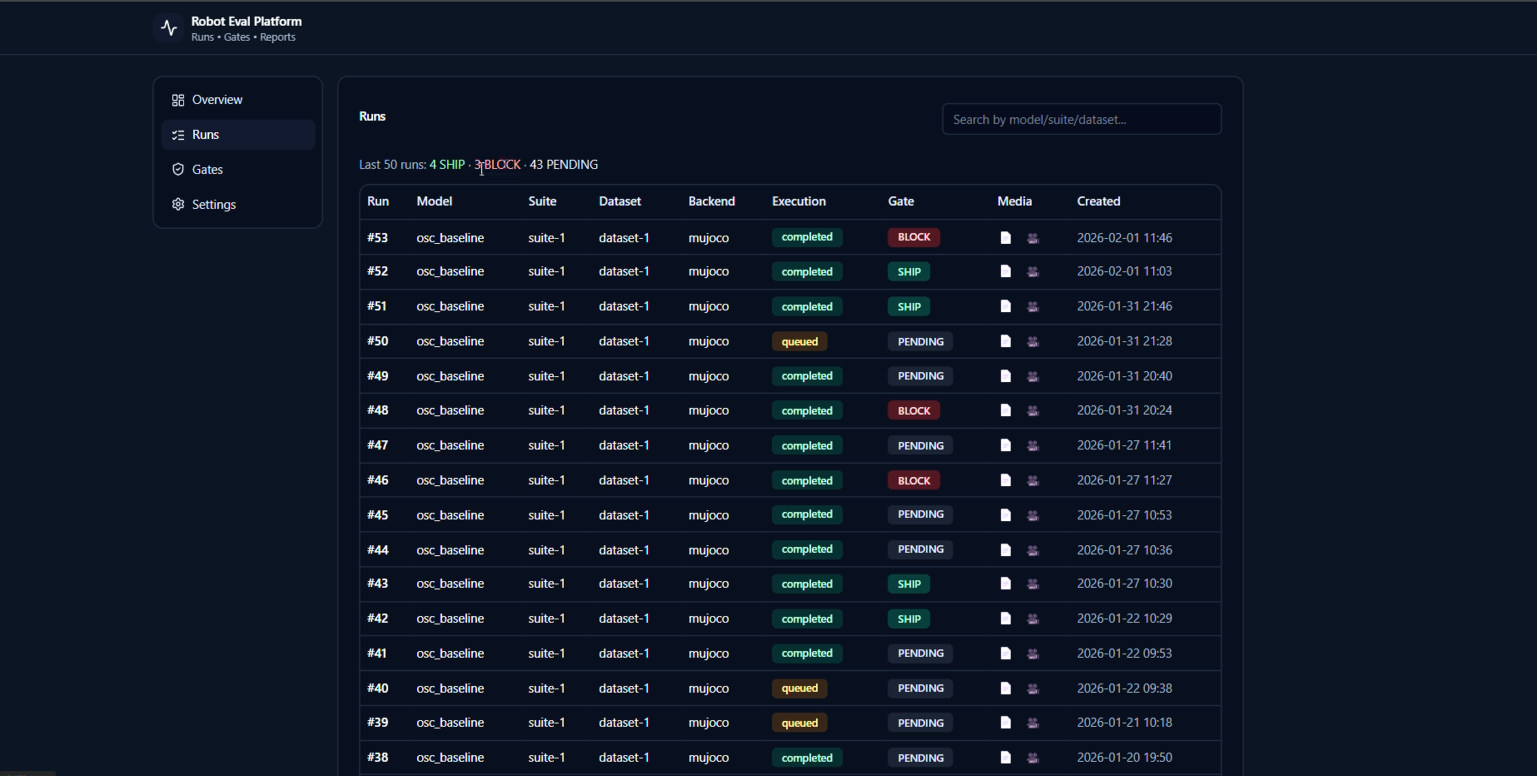
Robot Eval Platform — Regression Gating Outcomes
- Automated rollouts into metrics + videos + reports for every run.
- Baseline vs candidate comparison with a clear SHIP / BLOCK decision.
- Rules show exactly why a candidate is blocked (traceable + auditable).
Gate rules used in the demo
- Success rate ≥ baseline
- Mean control latency ≤ baseline
- Safety violations = 0
This is the “decision layer” that prevents silent regressions from reaching real robots.
Evidence (Screenshots + Demo Video)
Demo video (rollout + artifacts)
This demo shows: run execution → rollout video → metrics artifacts → gating decision (SHIP/BLOCK).
Key screenshots
Franka FR3 — Gesture-Driven UX + Sim2Real Validation (Free-space + Contact-rich)
3.06 mm
Best Final Reach Error (Task 1)
Participant P02, Trial 5 (Reach task) achieved 3.06 mm final positioning error.
≈99%
Learning Improvement (Reach task)
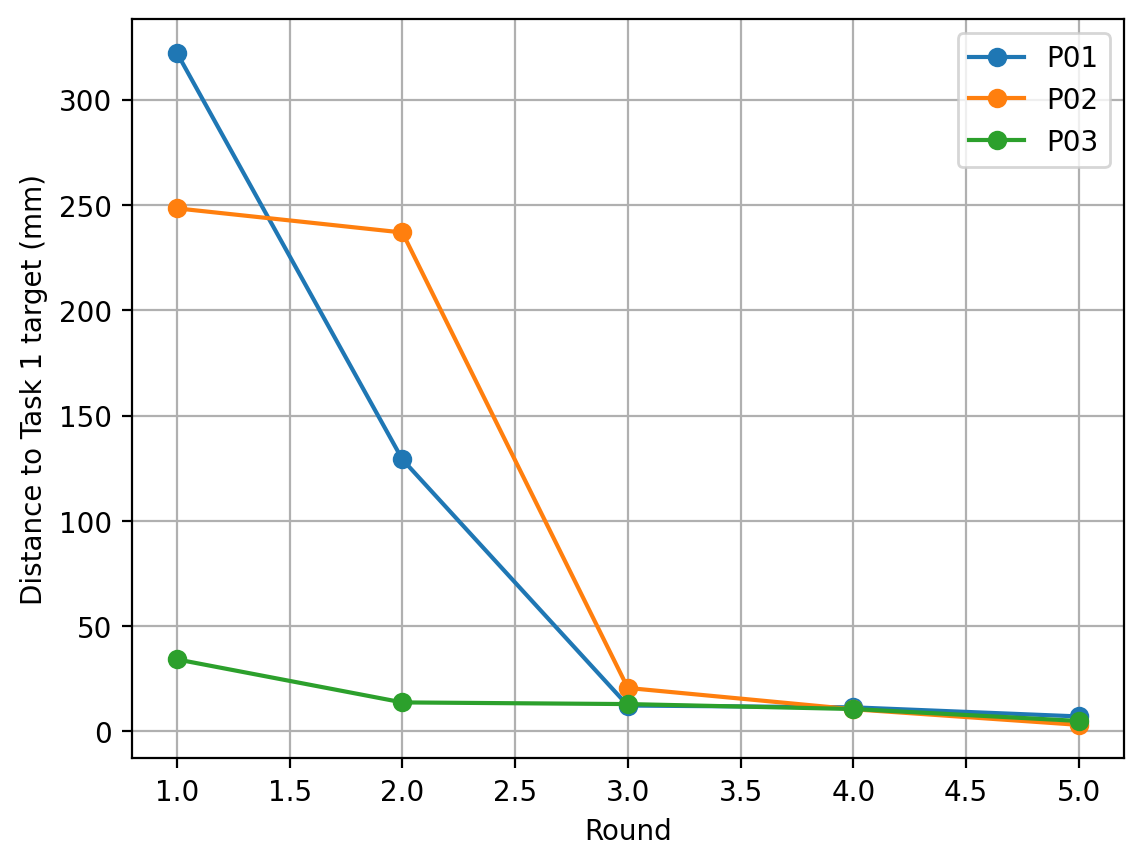
Large initial error reduced to single-digit mm (e.g., P02: 248 mm → 3 mm in 5 trials).
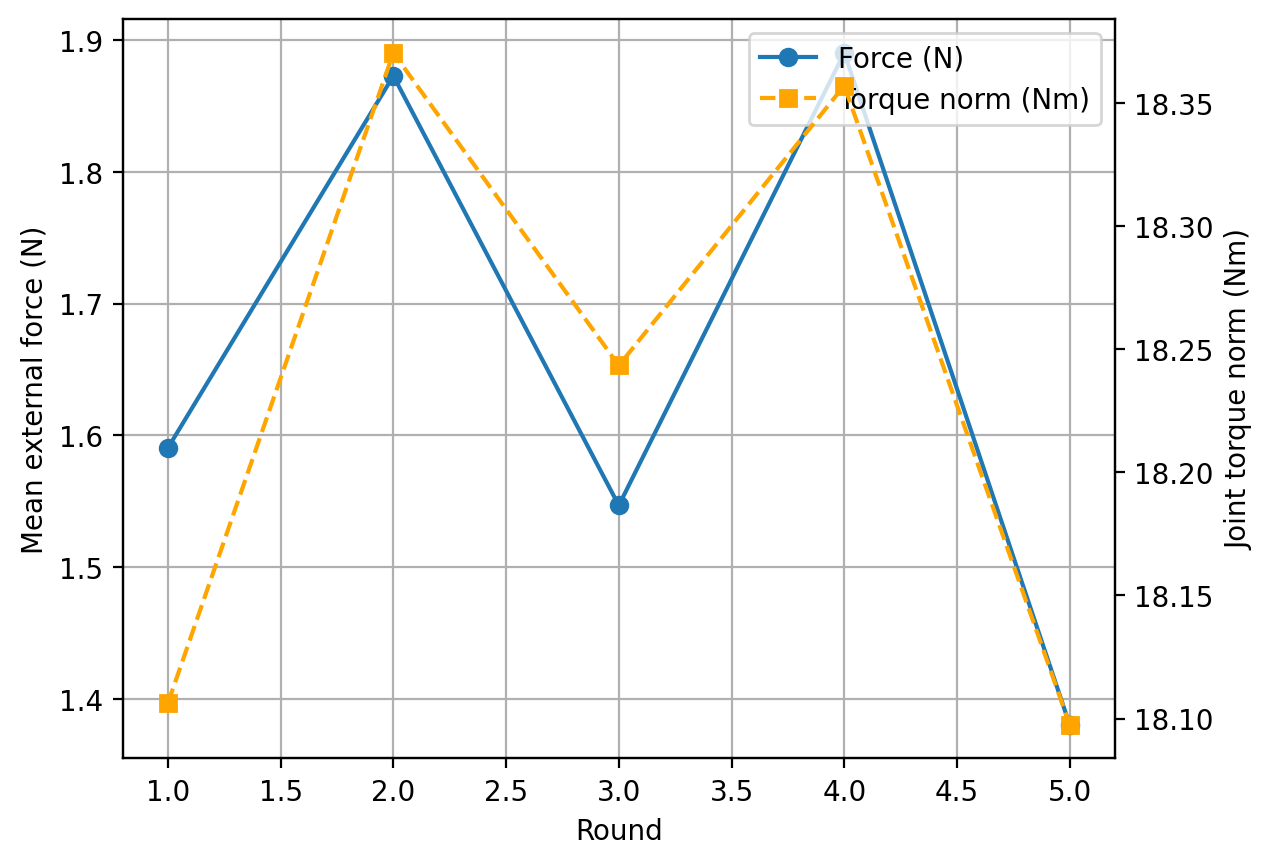
Up to 38.9 N
Contact Force Peak (Task 2)
Threaded insertion/screwing produced controlled forces (P01 peak 38.9 N, then stabilizing).
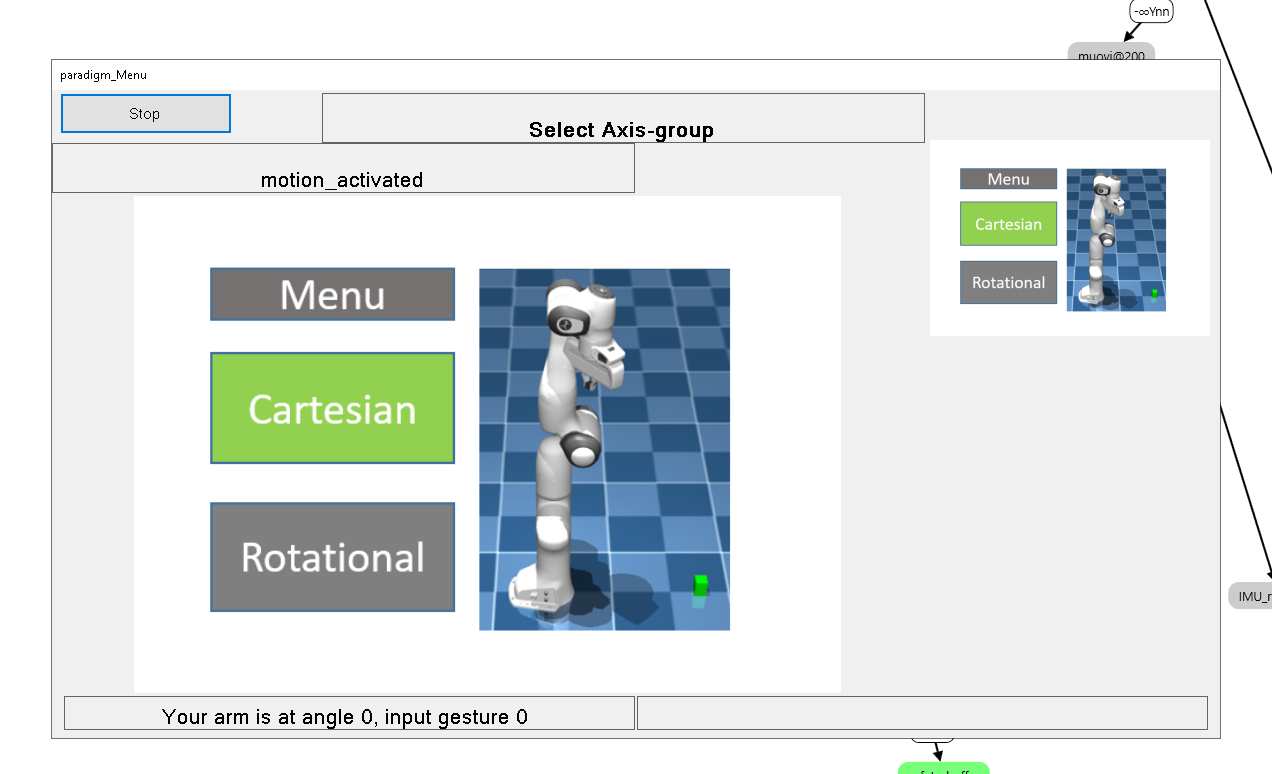
- Hand-gesture-driven UX (EMG/IMU) for axis selection + action execution via lock/unlock state machine.
- Cartesian motion + orientation control executed through Jacobian/IK-based control.
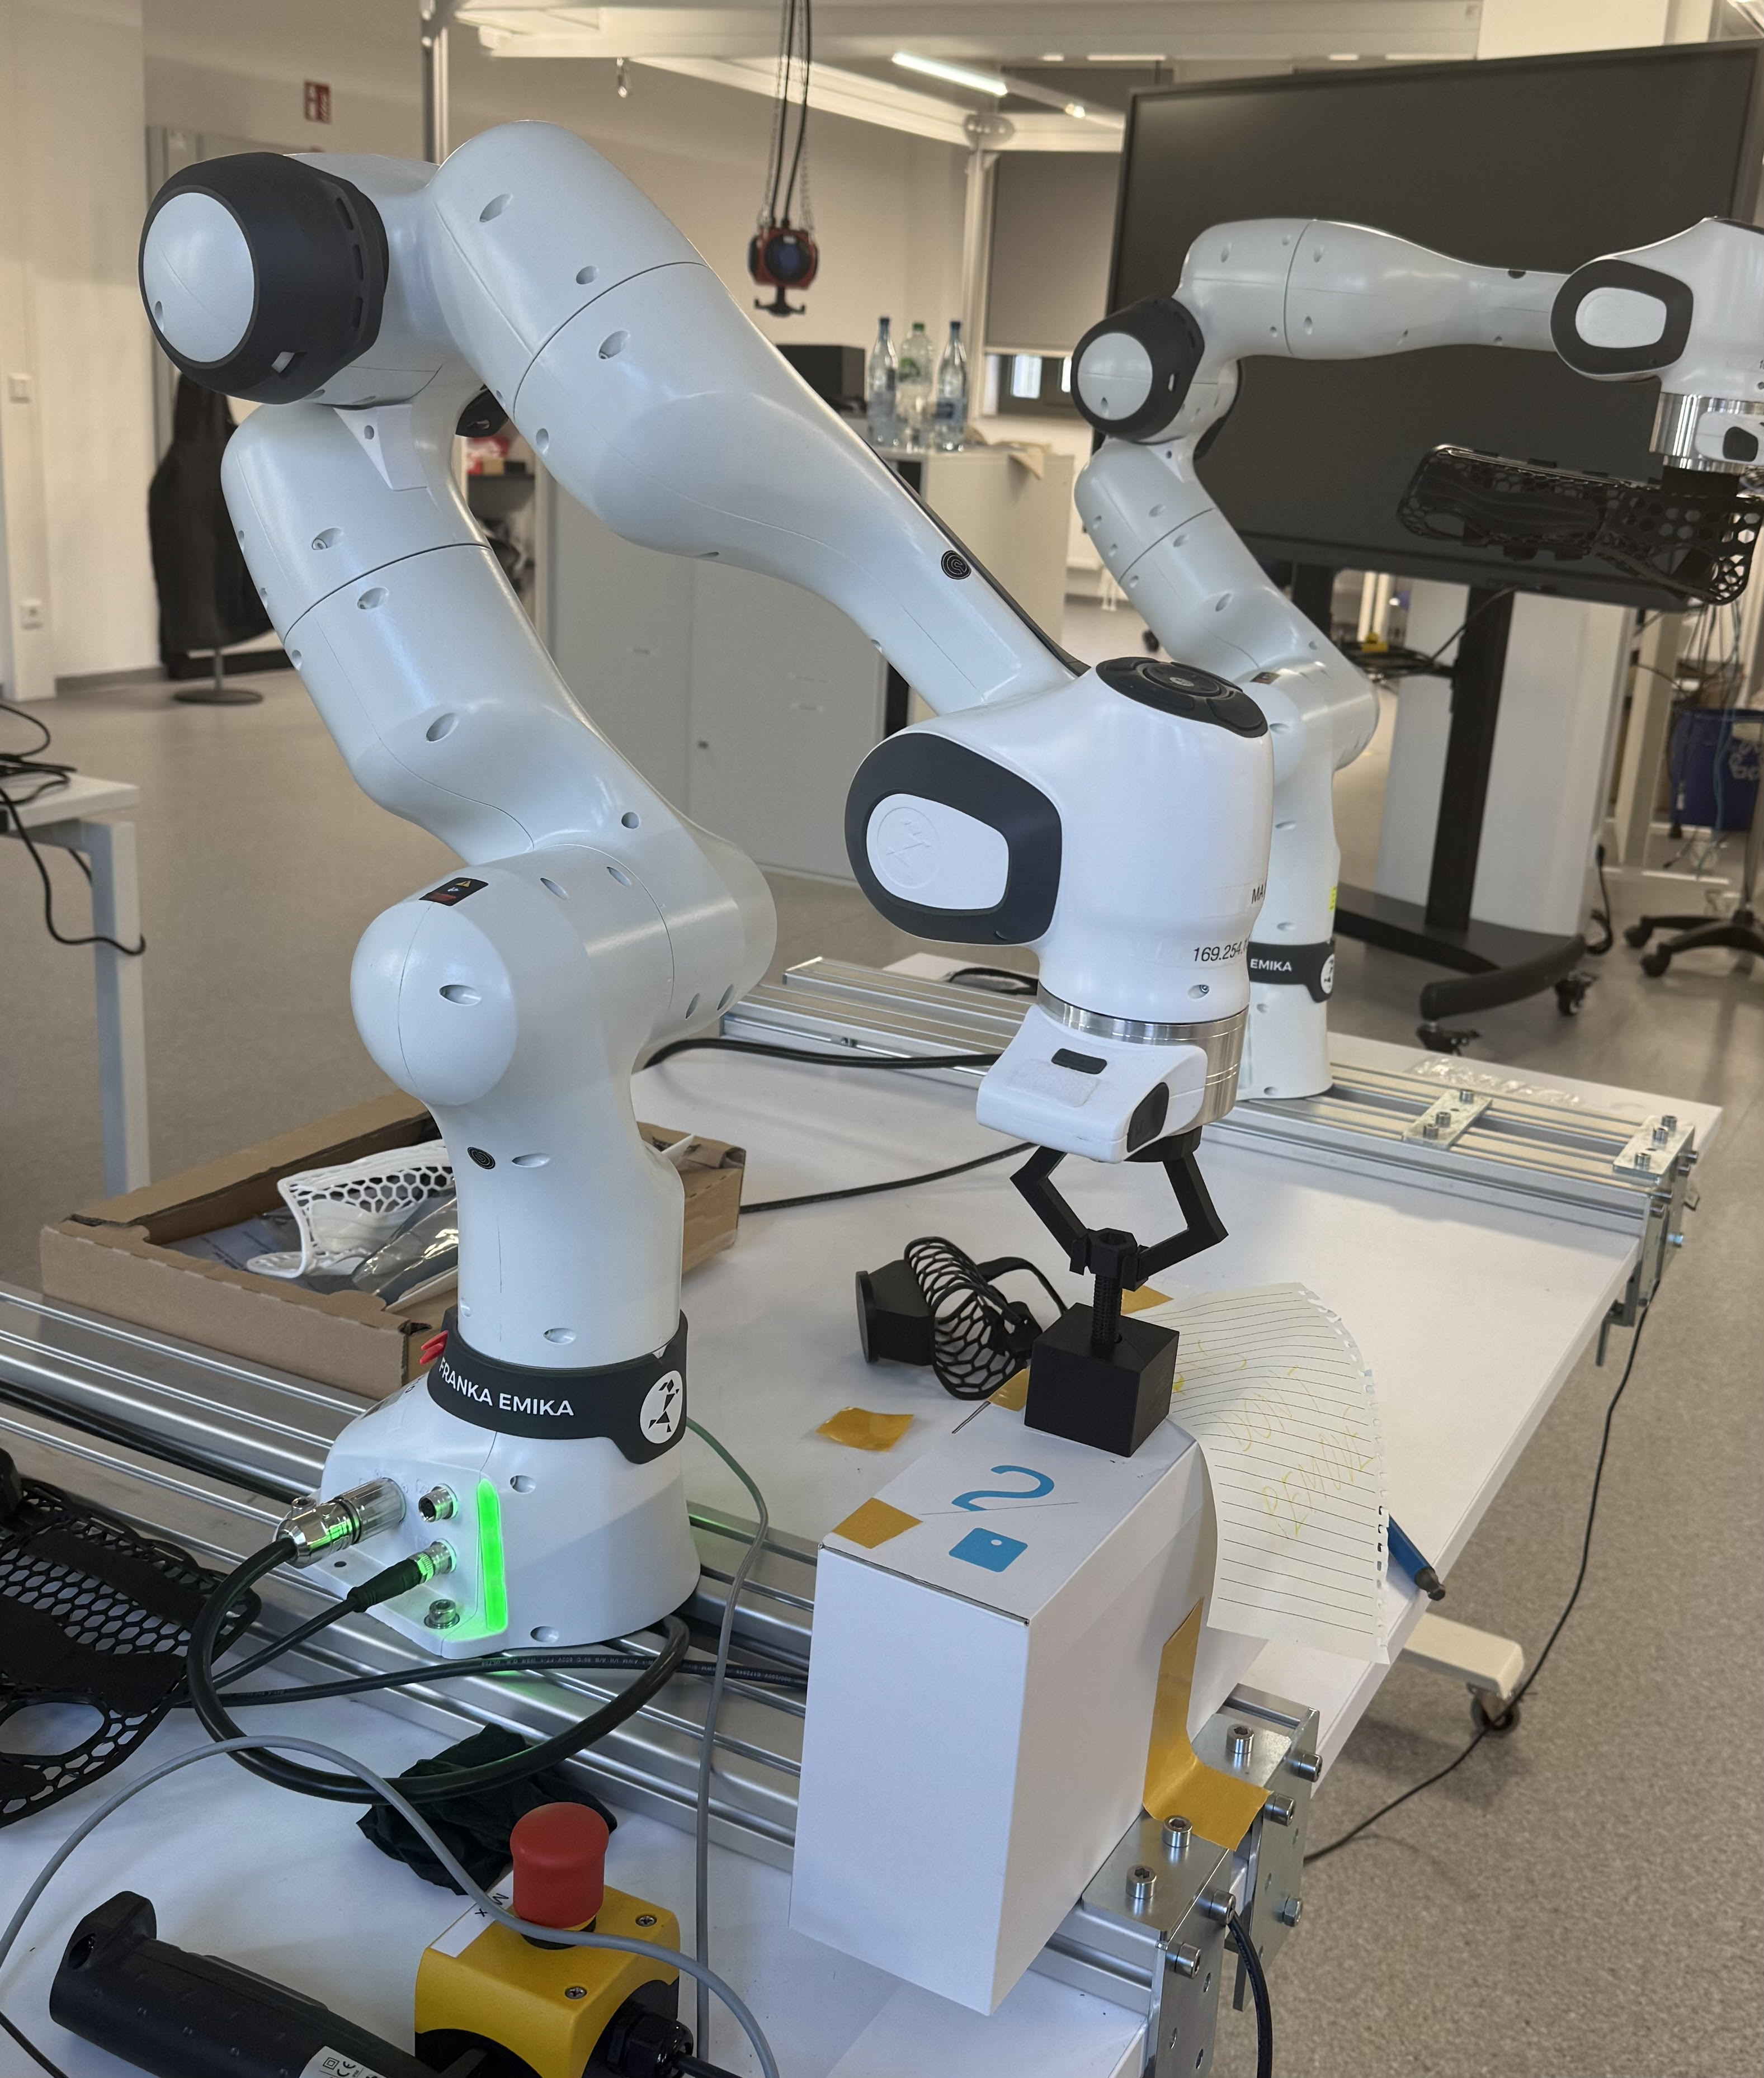
- Validated on real FR3 across both: Task 1 (free-space reach) and Task 2 (contact-rich screw depth).
- Objective metrics recorded from the FR3: end-effector pose error, force/torque behavior, and rotation alignment.
EMG / IMU
  ↓
Feature Extraction + Classification
  ↓
UX State Machine (scroll / lock / unlock)
  ↓
Cartesian Command (axis + direction)
  ↓
Jacobian/IK Controller (+ safety limits)
  ↓
MuJoCo Simulation  →  Real FR3 Deployment
Objective results snapshot (from user study)
| Participant | Task 1 Reach Error (Trial 1 → Trial 5) | Improvement | Task 2 Force Range (N) | Task 2 Rotation Error |
|---|---|---|---|---|
| P01 | 322.27 mm → 7.05 mm | ~97.8% | 4.46 – 38.94 N | ≤ 0.32° (then near 0°) |
| P02 | 248.40 mm → 3.06 mm | ~98.8% | 1.61 – 26.64 N | 0 – 0.15° |
| P03 | 34.16 mm → 4.91 mm | ~85.6% | 15.11 – 20.86 N | 0 – 0.07° |
For Task 2 (screwing), force/torque + alignment are the more informative indicators than positional error alone.
Evidence (Gesture UX + MuJoCo Simulation + Real FR3)
MuJoCo simulation demo
Demonstrates gesture-driven UX → Cartesian command execution in simulation.
Real FR3 deployment demo
Demonstrates the same UX/control workflow deployed on real hardware (FR3).
Screenshots (UX + plots)
What I optimize for
- Measurable progress (metrics-first, reproducible experiments)
- Stability & safety (limits, smooth control, robust behavior)
- Deployment readiness (CI-style checks and clear failure modes)
- Fast iteration (tight loop: simulate → evaluate → improve)